環境資訊中心外電;姜唯 翻譯;林大利 審校;稿源:ENS
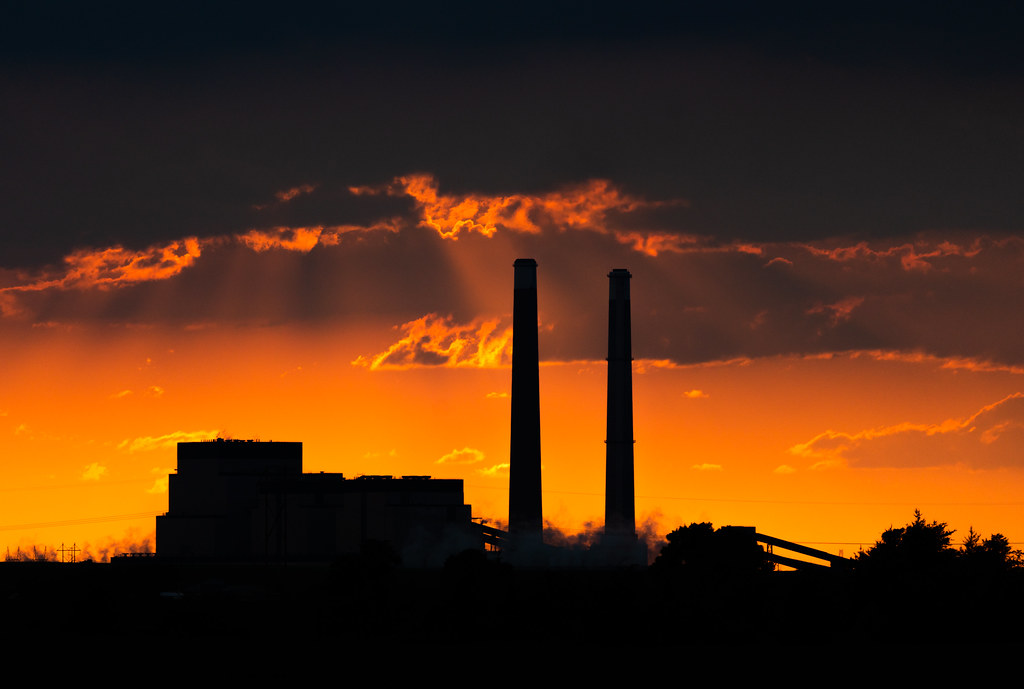
儘管全球為防堵武漢肺炎(COVID-19)而大規模封城,大氣中的溫室氣體濃度卻仍來到300萬年來最高。
氣候變遷沒有因為武漢肺炎而停下腳步。封城和經濟趨緩雖使碳排放出現暫時性下降,整體趨勢仍朝著肺炎爆發前的水準邁進。
2020年二氧化碳排放量將因為疫情關係減少4%至7%。確切能減少多少將取決於疫情控制情況和政府的應對措施。

今年雖然碰上疫情而大規模封城,大氣中的溫室氣體濃度卻仍來到300萬年來最高。照片來源:Tony Webster(CC BY-SA 2.0)
2016至2020年將是有史以來最熱的五年
全球最大、最具權威性的多個科學組織合作發表「2020科學界聯合報告(United in Science 2020)」,彙整出全面性的相關資訊。
這份報告是本系列報告的第二份,由世界氣象組織(World Meteorological Organization﹐WMO)協調,收集來自全球碳計畫(Global Carbon Project)、政府間氣候變遷專門委員會(Intergovernmental Panel on Climate Change)、聯合國教科文組織政府間海洋學委員會(Intergovernmental Oceanographic Commission of UNESCO)、聯合國環境規劃署(UN Environment Programme﹐UNEP)和英國氣象局的專業意見 。
「溫室氣體濃度已經達到300萬年來的最高水準,並持續上升中。同時在2020年上半年,西伯利亞大片地區出現長時間的異常熱浪,若不是人為的氣候變遷,這幾乎不可能發生。2016至2020年將是有史以來最熱的五年。」WMO秘書長塔拉斯(Petteri Taalas)教授警告,「這份報告說明了,儘管我們的生活在2020年多方被打亂,但氣候變遷的影響力並未減弱。」
暖化趨勢很可能會持續 使巴黎協定無法達成
乾旱和熱浪大幅增加了野火風險。有史以來野火造成的三次最大經濟損失都發生在最近四年。2019年和2020年夏季,北極地區發生了前所未有的野火。2019年6月,這些野火向大氣排放了5000萬噸二氧化碳,造成永凍土融化。2019年和2020年,亞馬遜雨林發生了大火,對環境造成了巨大影響。
2020科學界聯合報告引用的「世界天氣歸因」最近的一項研究結果指出,由於人為氣候變遷,2020年1月至2020年6月的高溫可能性至少高出600倍。
報告中記載的暖化趨勢很可能會持續下去,使全世界無法實現2015年巴黎協定設定的氣候目標,全球氣溫上升幅度遠低於工業化前水準2°C或僅比工業化高前1.5°C。
報告提供與氣候變遷相關的最新科學資料和發現,作為全球政策和行動的指引。內容聚焦氣候變遷的影響日益增加且不可逆轉,它影響冰川、海洋、自然、經濟和人類生活條件,人類往往可從乾旱或洪水等與水有關的危害切身感受到。
報告也記載了武漢肺炎如何破壞我們透過全球觀測系統監測這些變化的能力。

有史以來野火造成的三次最大經濟損失都發生在最近四年。照片來源: Ulet Ifansasti/Greenpeace(CC BY-NC-ND 2.0)
2020科學界聯合報告的主要發現
大氣中的溫室氣體濃度(世界氣象組織)
大氣中的二氧化碳濃度沒有要封頂的跡象,一直在打破紀錄。
根據WMO全球大氣監測網水準點的報告,2020年上半年二氧化碳濃度高於410 ppm,夏威夷冒納羅亞和澳洲塔斯馬尼亞格里姆角的觀測值分別為414.38 ppm和410.04 ppm。2020年比2019年7月增加了約3 ppm。
2020年二氧化碳排放量的減少只會輕微影響大氣中濃度的增加速度,因為今日大氣中二氧化碳濃度是過去和當前排放以及二氧化碳超長壽命所致結果。
WMO在其報告中表示:「要使氣候變遷穩定下來,必須將排放量持續減少至零淨值。」
全球化石燃料二氧化碳排放量(全球碳計畫)
由於武肺封鎖,2020年二氧化碳排放量預計將下降4%至7%。確切的下降百分比將取決於疫情控制狀況和政府因應方式。
2020年4月上旬的封城高峰期,全球每日化石燃料二氧化碳排放量與2019年相比下降了前所未有的17%。
但儘管如此,排放量仍與2006年的水準相當,凸顯過去15年來的急劇增長及長期依賴化石能源。
到2020年6月上旬,全球每日化石燃料排放量只比2019年水準低了5%不到,去年達到了367億公噸的新紀錄,比1990年氣候變遷談判開始時高62%。
過去10年間,人類活動產生的全球甲烷排放量也在持續增加。報告警告:「目前的二氧化碳和甲烷排放趨勢均無法達到巴黎協定目標。」
排放差距(聯合國環境規劃署)
聯合國環境規劃署呼籲,要實現巴黎協定目標,轉型行動不能再延。
環境署「2019年排放差距報告」顯示,從2020~2030年,要達到巴黎協定的2°C目標,每年要將全球排放量削減3%,要達到1.5°C目標平均每年要削減7%以上。
根據目前的預估,2030年與2°C目標的排放差距為120~150億公噸二氧化碳當量(CO2e),與1.5°C目標的排放差距為29~32吉噸二氧化碳當量,大約等於六個最大排放國的排放總量。
環境署說:「仍然有可能縮小這個排放差距,但需要所有國家和所有部門立即協調一致的行動……短期來說可以透過擴大現有的有效的政策來實現,例如再生能源和能源效率、低碳運輸以及逐步淘汰煤炭的政策。」
全球氣候狀況(WMO和英國氣象局)
2016~2020年的全球平均溫度將是有記錄以來最高溫,比前工業化時代參考期1850~1900年高出約1.1°C,比2011~2015年的全球平均溫度高出0.24°C。
在2020年至2024年這五年期間,至少有一年比工業化前水準高出1.5°C以上的機率是24%,五年平均值超過該水準的機會很小(3%)。兩家機構在報告中表示:「未來五年內,有70%的機率有一個或多個月的氣溫可能比工業化前高至少1.5°C。」
2016年至2020年間的每一年,北極海冰面積都低於平均水準。
2016至2019年的冰川質量損失均大於1950年以來的每個五年期。
2011至2015年和2016至2020年這兩個五年相比,全球平均海平面上升速度有所提高。
氣候變遷下的海洋和冰凍圈(政府間氣候變遷專門委員會)
人為氣候變遷正在影響從山頂到海洋深處的生命維持系統,導致海平面上升加快,對生態系統和人類安全產生連鎖反應,也對適應和綜合風險管理造成嚴峻挑戰。
全球的冰蓋和冰川正在消失。1979年至2018年間,一年之中每個月的北極海冰範圍都一直在減少。野火增加、永凍土突然融化以及北極和山區水文的變化,已經改變了生態系統擾動的頻率和強度。
1970年以來,全球海洋暖化不停息,並吸收了氣候系統90%以上的多餘熱量。自1993年以來,海洋暖化的速度和所吸收的來自氣候系統的熱量增加了一倍以上。
海洋熱浪的頻率增加了一倍,持續時間更長、強度更大、範圍更廣,導致大規模珊瑚白化。自1980年代以來,海洋吸收了人為二氧化碳總排放量的20%至30%,使海洋進一步酸化。
自大約1950年以來,海洋暖化、海冰變化和氧氣流失,許多海洋物種的分佈範圍和季節性活動發生了變化。
由於格陵蘭和南極冰蓋的冰流失率增加、冰川持續流失和海洋熱膨脹,近幾十年來海平面加速上升。2006至2015年全球平均海平面上升速度為每年3.6±0.5公釐,這在上個世紀前所未見。

全球的冰蓋和冰川正在消失。美國冰河灣國家公園。照片來源:mulf(CC BY-NC-ND 2.0)
氣候與水資源(WMO)
氣候變遷最明顯的影響出現在水文條件的變化,包括冰雪動力學的變化。
到2050年,受洪水威脅的人數將從目前的12億增加到16億。在2010年代初到中期,有19億人(全球人口的27%)生活在可能缺水的地區。到2050年,這個數字將增加到27~32億。
截至2019年,全世界有12%人口的飲用水來自未經改進和不安全的水源。全世界有30%以上的人口(即24億人)沒有任何形式的衛生設施。
氣候變遷將使更多地區缺水,已經缺水的地區將更嚴重。
冰凍圈是山區及其下游地區的重要淡水來源。學界認為,冰川的年徑流最晚將在21世紀末達到全球最高峰。此後全球冰川徑流將減少,影響水的儲存。
據估計,中歐和高加索地區現已達到最高水位,青藏高原地區將在2030年至2050年達到最高水位。隨著積雪融化形成徑流,該地區的永凍土和冰川佔河流總流量的45%,流量減少將影響17億人的用水。
武肺期間的地球系統觀測(教科文組織和WMO政府間海洋學委員會)
武漢肺炎嚴重影響全球觀測工作,進而影響預報以及其他天氣、氣候和海洋相關服務的品質。
3月和4月的飛行器觀測工作平均減少了75%至80%,降低了天氣模型的預報能力。自6月以來僅略有恢復。人工操作的氣象站觀測工作也受到嚴重干擾,尤其在非洲和南美。
諸如河流流量之類的水文觀測情況也類似。自動化系統可以繼續傳遞數據,而人工讀取的測量站受到影響。
2020年3月,幾乎所有海洋學研究船都被召回國籍港口。商用船無法提供重要的海洋和天氣觀測資料,並且無法維護海洋浮標和其他系統。每10年要進行四次的全深度海洋調查,包括碳、溫度、鹽度和水鹼度等變量偵測,都取消了。提供溫室氣體排放資訊的的船舶表面碳測量工作也幾乎停止。
這對氣候變遷監測的影響是長期的,可能會阻礙或限制融冰期結束時進行的冰川質量變化或永凍土厚度的測量活動。觀測活動中斷將使基本氣候變量的歷史時間序列產生斷層,不利監測氣候變動和變遷以及相關影響。
Climate Change Intensifies Despite Pandemic Lockdowns GENEVA, Switzerland, September 10, 2020 (ENS)
Already at their highest levels in three million years, greenhouse gas concentrations in the atmosphere continue to increase, lockdowns around the world to slow the spread of the pandemic coronavirus have forced vehicles to stay parked, making way for clearer skies – temporarily.
But climate change has not stopped for COVID-19. Emissions are heading in the direction of pre-pandemic levels following a temporary decline caused by the lockdown and economic slowdown.
In 2020, emissions of the greenhouse gas carbon dioxide (CO2) are projected to fall by an estimated four to seven percent due to COVID-19 confinement policies. The exact drop in atmospheric CO2 will depend on the trajectory of the pandemic and government responses to address it.
These facts are contained in a new multi-agency report from the world’s largest and most respected scientific organizations, “United in Science 2020.”
The report, the second in a series, was coordinated by the World Meteorological Organization, WMO, with input from the Global Carbon Project, the Intergovernmental Panel on Climate Change, the Intergovernmental Oceanographic Commission of UNESCO, the UN Environment Programme and the UK Met Office.
WMO Secretary-General Professor Petteri Taalas warned, “Greenhouse gas concentrations – which are already at their highest levels in three million years – have continued to rise. Meanwhile, large swathes of Siberia have seen a prolonged and remarkable heatwave during the first half of 2020, which would have been very unlikely without anthropogenic climate change. And now 2016–2020 is set to be the warmest five-year period on record.
“This report shows that whilst many aspects of our lives have been disrupted in 2020, climate change has continued unabated,” Taalas said.
“Major impacts have been caused by extreme weather and climate events. A clear fingerprint of human-induced climate change has been identified on many of these extreme events,” the WMO and UN Met Office say in the report.
Drought and heatwaves substantially increased the risk of wildfires. The three largest economic losses on record from wildfires have all occurred in the last four years. Summer 2019 and 2020 saw unprecedented wildfires in the Arctic region. In June 2019, these fires emitted 50 million tonnes of CO2 into the atmosphere and caused the loss of permafrost. In 2019 and 2020 there were also widespread fires in the Amazon rainforest, with dramatic environmental impacts.
The results of a recent study by World Weather Attribution cited in “United in Science 2020” showed with high confidence that the January to June 2020 heat is at least 600 times more likely as a result of human-induced climate change.
The warming trend documented in this report is likely to continue, and the world is not on track to meet targets set in the 2015 Paris Agreement on climate to keep the global temperature increase well below 2°C or at 1.5°C above pre-industrial levels.
“United in Science 2020” presents the latest scientific data and findings related to climate change to inform global policy and action. It highlights the increasing and irreversible impacts of climate change, which affects glaciers, oceans, nature, economies and human living conditions and is often felt through water-related hazards such as drought or flooding.
It also documents how COVID-19 has impeded our ability to monitor these changes through the global observing system.
“This has been an unprecedented year for people and planet. The COVID-19 pandemic has disrupted lives worldwide. At the same time, the heating of our planet and climate disruption has continued apace,” said UN Secretary-General António Guterres in a foreword to the report.
“Never before has it been so clear that we need long-term, inclusive, clean transitions to tackle the climate crisis and achieve sustainable development. We must turn the recovery from the pandemic into a real opportunity to build a better future,” said Guterres, who presented the report to the UN on Wednesday. “We need science, solidarity and solutions.”
KEY FINDINGS FROM “UNITED IN SCIENCE 2020”
Greenhouse Gas Concentrations in the Atmosphere (World Meteorological Organization)
Atmospheric CO2 concentrations showed no signs of peaking and have continued to increase to new records.
Benchmark stations in the WMO Global Atmosphere Watch network reported CO2 concentrations above 410 parts per million (ppm) during the first half of 2020, with observations from Mauna Loa, Hawaii and Cape Grim, Tasmania at 414.38 ppm and 410.04 ppm, respectively, in July 2020, up about three parts per million from July 2019.
Reductions in emissions of CO2 in 2020 will only slightly impact the rate of increase in the atmospheric concentrations, which are the result of past and current emissions, as well as the very long lifetime of CO2.
“Sustained reductions in emissions to net zero are necessary to stabilize climate change,” the WMO states in its report.
Global Fossil CO2 emissions (Global Carbon Project)
CO2 emissions in 2020 will fall by an estimated four percent to seven percent due to COVID-19 confinement policies. The exact percent of decline will depend on the trajectory of the pandemic and government responses to address it.
During peak lockdown in early April 2020, the daily global fossil CO2 emissions dropped by an unprecedented 17 percent compared to 2019.
But even so, emissions were still equivalent to 2006 levels, highlighting both the steep growth over the past 15 years and the continued dependence on fossil sources for energy.
By early June 2020, global daily fossil CO2 emissions had mostly returned to within five percent below 2019 levels, which reached a new record of 36.7 gigatonnes last year, 62 percent higher than at the start of climate change negotiations in 1990.
Global methane emissions from human activities, too, have continued to increase over the past decade. “Current emissions of both CO2 and methane are not compatible with emissions pathways consistent with the targets of the Paris Agreement,” the report warns.
Emissions Gap (UN Environment Programme)
“Transformational action can no longer be postponed if the Paris Agreement targets are to be met,” urges the UN Environment Programme.
The UNEP Emissions Gap Report 2019 showed that the cuts in global emissions required per year from 2020 to 2030 are close to three percent for a 2°C target and more than seven percent per year on average for the 1.5°C goal of the Paris Agreement.
The Emissions Gap in 2030 is estimated at 12-15 gigatonnes (Gt) of carbon dioxide equivalent (CO2e) to limit global warming to below 2°C. For the 1.5°C goal, the gap is estimated at 29-32 Gt CO2e, roughly equivalent to the combined emissions of the six largest-emitting countries.
“It is still possible to bridge the emissions gap, but this will require urgent and concerted action by all countries and across all sectors,” UNEP said.
“A substantial part of the short-term potential can be realized through scaling up existing, well-proven policies, for instance on renewables and energy efficiency, low carbon transportation means and a phase-out of coal,” the UN agency said.
Technically and economically feasible solutions already exist, said UNEP. Looking beyond the 2030 timeframe, new technological solutions and gradual change in consumption patterns are needed at all levels.
State of Global Climate (WMO and UK’s Met Office)
The average global temperature for 2016–2020 is expected to be the warmest on record, about 1.1°C above 1850-1900, a reference period for temperature change since pre-industrial times and 0.24°C warmer than the global average temperature for 2011-2015.
In the five-year period 2020–2024, the chance of at least one year exceeding 1.5°C above pre-industrial levels is 24 percent, with a very small chance (three percent) of the five-year mean exceeding this level. “It is likely (~70 percent chance) that one or more months during the next five years will be at least 1.5 °C warmer than pre-industrial levels,” the two agencies said in the report.
In every year between 2016 and 2020, the Arctic sea ice extent has been below average.
The years 2016–2019 recorded a greater glacier mass loss than all other past five-year periods since 1950.
The rate of global mean sea-level rise increased between the five-year periods 2011–2015 and 2016–2020.
The Ocean and Cryosphere in a Changing Climate (Intergovernmental Panel on Climate Change)
Human-induced climate change is affecting life-sustaining systems, from the top of the mountains to the depths of the oceans, leading to accelerating sea-level rise, with cascading effects for ecosystems and human security.
This increasingly challenges adaptation and integrated risk management responses.
Ice sheets and glaciers worldwide have lost mass. Between 1979 and 2018, Arctic sea-ice extent has decreased for all months of the year. Increasing wildfire and abrupt permafrost thaw, as well as changes in Arctic and mountain hydrology, have altered the frequency and intensity of ecosystem disturbances.
The global ocean has warmed unabated since 1970 and has taken up more than 90 percent of the excess heat in the climate system. Since 1993 the rate of ocean warming, and thus heat uptake has more than doubled.
Marine heatwaves have doubled in frequency and have become longer-lasting, more intense and more extensive, resulting in large-scale coral bleaching events. The ocean has absorbed between 20 percent to 30 percent of total anthropogenic CO2 emissions since the 1980s causing further ocean acidification.
Since about 1950 many marine species have undergone shifts in geographical range and seasonal activities in response to ocean warming, sea-ice change and oxygen loss.
The global mean sea-level is rising, with acceleration in recent decades due to increasing rates of ice loss from the Greenland and Antarctic ice sheets, as well as continued glacier mass loss and ocean thermal expansion. The rate of global mean sea-level rise for 2006–2015 of 3.6 ±0.5 mm/yr is unprecedented over the last century
Climate and Water Resources (WMO)
Climate change impacts are most felt through changing hydrological conditions including changes in snow and ice dynamics.
By 2050, the number of people at risk of floods will increase from its current level of 1.2 billion to 1.6 billion. In the early to mid-2010s, 1.9 billion people, or 27 percent of the global population, lived in potentially water-scarce areas. In 2050, this number will increase to 2.7 to 3.2 billion people.
As of 2019, 12 percent of the world population drinks water from unimproved and unsafe sources. More than 30 percent of the world population, or 2.4 billion people, live without any form of sanitation.
Climate change is projected to increase the number of water-stressed regions and exacerbate shortages in already water-stressed regions.
The cryosphere is an important source of freshwater in mountains and their downstream regions. There is high confidence that annual runoff from glaciers will reach peak globally at the latest by the end of the 21st century. After that, glacier runoff is projected to decline globally with implications for water storage.
It is estimated that Central Europe and Caucasus have reached peak water now and that the Tibetan Plateau region will reach peak water between 2030 and 2050. As runoff from snow cover, permafrost and glaciers in this region provides up to 45 percent of the total river flow, the flow decrease would affect water availability for 1.7 billion people.
Earth System Observations during COVID-19 (Intergovernmental Oceanographic Commission of UNESCO and WMO)
The COVID-19 pandemic has produced significant impacts on the global observing systems, which in turn have affected the quality of forecasts and other weather, climate and ocean-related services.
The reduction of aircraft-based observations by an average of 75 percent to 80 percent in March and April degraded the forecast skills of weather models. Since June, there has been only a slight recovery. Observations at manually operated weather stations, especially in Africa and South America, have also been badly disrupted.
For hydrological observations like river discharge, the situation is similar to that of atmospheric in situ measurements. Automated systems continue to deliver data whereas gauging stations that depend on manual reading are affected.
In March 2020, nearly all oceanographic research vessels were recalled to home ports. Commercial ships have been unable to contribute vital ocean and weather observations, and ocean buoys and other systems could not be maintained. Four full-depth ocean surveys of variables such as carbon, temperature, salinity, and water alkalinity, completed only once per decade, have been canceled. Surface carbon measurements from ships, which tell us about the evolution of greenhouse gases, also effectively ceased.
The impacts on climate change monitoring are long-term. They are likely to prevent or restrict measurement campaigns for the mass balance of glaciers or the thickness of permafrost, usually conducted at the end of the thawing period. The overall disruption of observations will introduce gaps in the historical time series of Essential Climate Variables needed to monitor climate variability and change and associated impacts.
※ 全文及圖片詳見:ENS
溫室氣體
冰川崩塌
熱浪
極端高溫
山林野火
極圈
疫情看氣候與能源
深度低碳專題
國際新聞
氣候變遷
作者

如果有一件事是重要的,如果能為孩子實現一個願望,那就是人類與大自然和諧共存。

於特有生物研究保育中心服務,小鳥和棲地是主要的研究對象。是龜毛的讀者,認為龜毛是探索世界的美德。
本站聲明:網站內容來源環境資訊中心https://e-info.org.tw/,如有侵權,請聯繫我們,我們將及時處理
【其他文章推薦】
※USB CONNECTOR掌控什麼技術要點? 帶您認識其相關發展及效能
※台北網頁設計公司這麼多該如何選擇?
※智慧手機時代的來臨,RWD網頁設計為架站首選
※評比南投搬家公司費用收費行情懶人包大公開
※回頭車貨運收費標準